Now that Pittsburgh Steelers quarterback Ben Roethlisberger has his first game back from injury behind him, he should get back on track, right? Well, if is career history is any guide, one shouldn’t expect Roethlisberger to win the AFC Offensive Player of the Week award this coming Sunday.
In his previous seven second games back from injury, not only is Roethlisberger 2-5 in those contests, he’s completed just 57.5% of his passes as part of him averaging 276 yards passing per game with 10 touchdowns and 10 interceptions. Roethlisberger also threw at least one interception in six of those seven games and only once did he complete more than 60% of his passes.
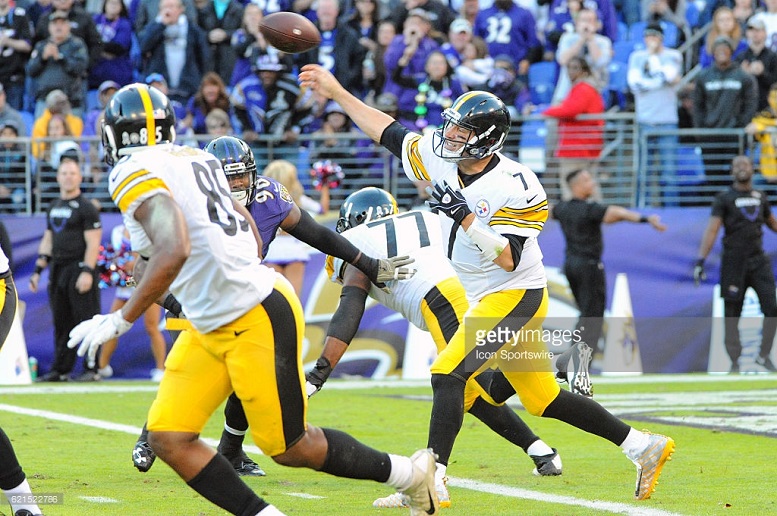
Leading up to this past Sunday’s road loss to the Baltimore Ravens, Roethlisberger, as expected, practiced on a limited basis. While he really didn’t look bad from a physical and mobility standpoint against the Ravens, he did look rusty and just like a quarterback that hadn’t practiced fully since suffering his injury.
On Tuesday, Steelers head coach Mike Tomlin indicated that while Roethlisberger came out of the game against the Ravens no worse for wear, he would likely be limited in practice once again this week. That’s not overly surprising as Roethlisberger is now just 22 days removed from having the meniscus in his left knee repaired.
Sunday at Heinz Field, the Steelers will host the (7-1) Dallas Cowboys and while their defense does have 18 total sacks on the season, they’ve only intercepted 4 passes in 8 games. Additionally, the Cowboys defense has allowed a 68% completion rate heading into Week 10.
If it’s any consolation to you, Roethlisberger has thrown for more than 300 yards in his two most-recent second games back from injury. Additionally, the Steelers averaged 31-points scored in those two games. They might very well need 31 points Sunday at home against the Cowboys as the Dallas offense hasn’t had many issues so far the season when it comes to making the numbers on the scoreboard go up.
| YEAR | WK | OPP | RESULT | COMP | ATT | PCT | YDS | AVG | TD | INT | SCK | RATE |
|---|---|---|---|---|---|---|---|---|---|---|---|---|
| 2005 | 8 | BAL | W 20-19 | 18 | 30 | 60.0% | 177 | 5.90 | 2 | 1 | 2 | 85 |
| 2005 | 13 | CIN | L 31-38 | 29 | 41 | 70.7% | 386 | 9.40 | 3 | 3 | 2 | 94.2 |
| 2006 | 3 | CIN | L 20-28 | 18 | 39 | 46.2% | 208 | 5.30 | 0 | 3 | 3 | 30.7 |
| 2009 | 14 | @CLE | L 6-13 | 18 | 32 | 56.3% | 201 | 6.30 | 0 | 0 | 8 | 75.1 |
| 2011 | WC | @DEN | L 23-29 | 22 | 40 | 55.0% | 289 | 7.20 | 1 | 1 | 5 | 75.9 |
| 2012 | 15 | @DAL | L 24-27 | 24 | 40 | 60.0% | 339 | 8.50 | 2 | 1 | 4 | 93.6 |
| 2015 | 9 | OAK | W 38-35 | 24 | 44 | 54.5% | 334 | 7.60 | 2 | 1 | 1 | 84.5 |
| TOTALS | 153 | 266 | 57.5% | 1934 | 7.27 | 10 | 10 | 25 | ||||
| AVERAGE | 21.9 | 38 | 57.5% | 276.3 | 7.27 | 1.4 | 1.4 | 3.6 | ||||