In this two-part study, I first take a look at Ben Roethlisberger’s statistical performance at home vs on the road from 2014-2016; then, in part 2, I tried to find some possible explanations for the great disparity in his quality of play by looking at the opponents he faced.
Specifically in this first article, I wanted to see if Roethlisberger performed worse across the board when he was away from Heinz Field, rather than looking exclusively at his QB rating or TD/INT ratio (spoiler alert: he did). This article is a little stats and charts heavy because I wanted to get some of the raw numbers out there before discussing possible explanations.
In part 2, I chart opponents’ win percentages, various defense-specific rankings of home/away opponents, sacks, and weather conditions, in hopes of finding a possible explanation for Roethlisberger’s poor numbers.
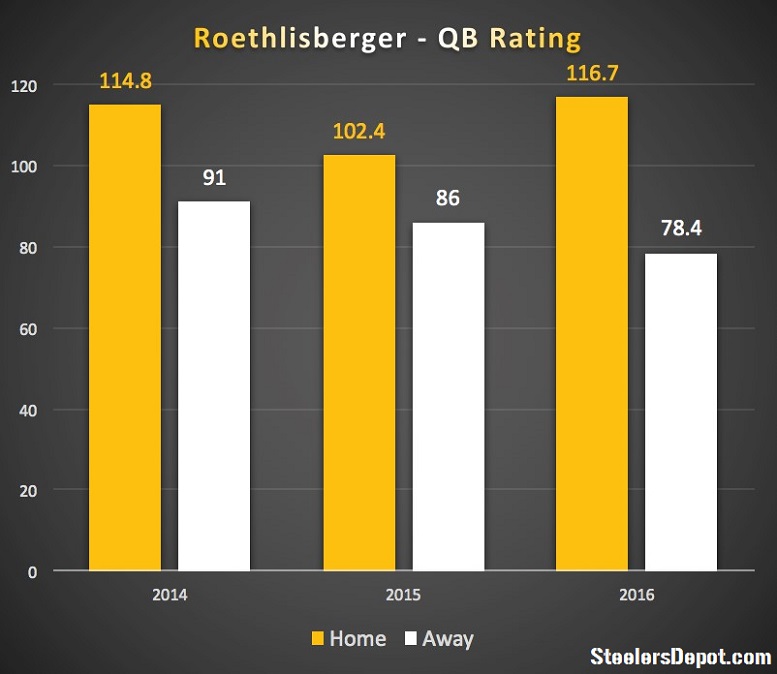
QB Rating
Earlier this year, Mathew Marczi wrote about how, from 2014-2016, Roethlisberger has the BEST QB rating in the NFL when playing at home (111.5), while also having the fifth WORST rating of any QB when on the road (85.1). I charted his year-to-year home/away rating below:
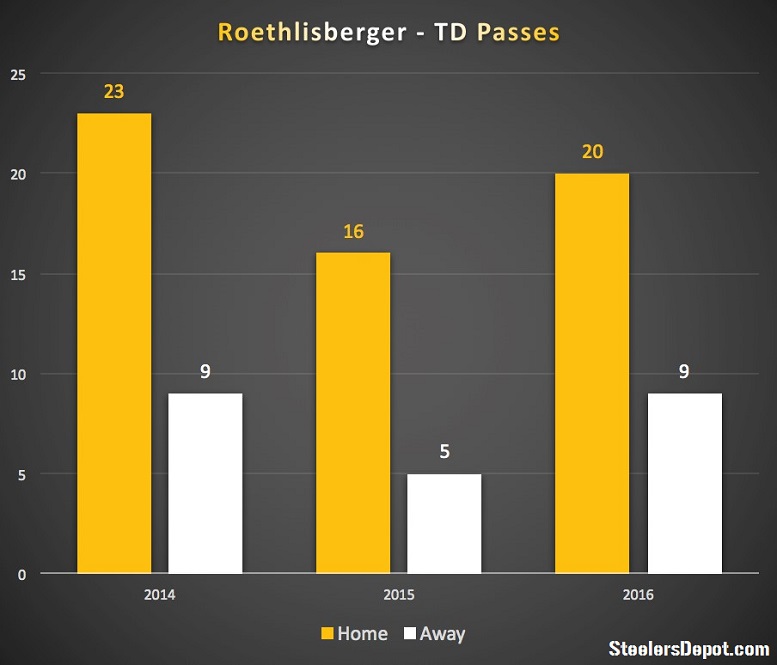
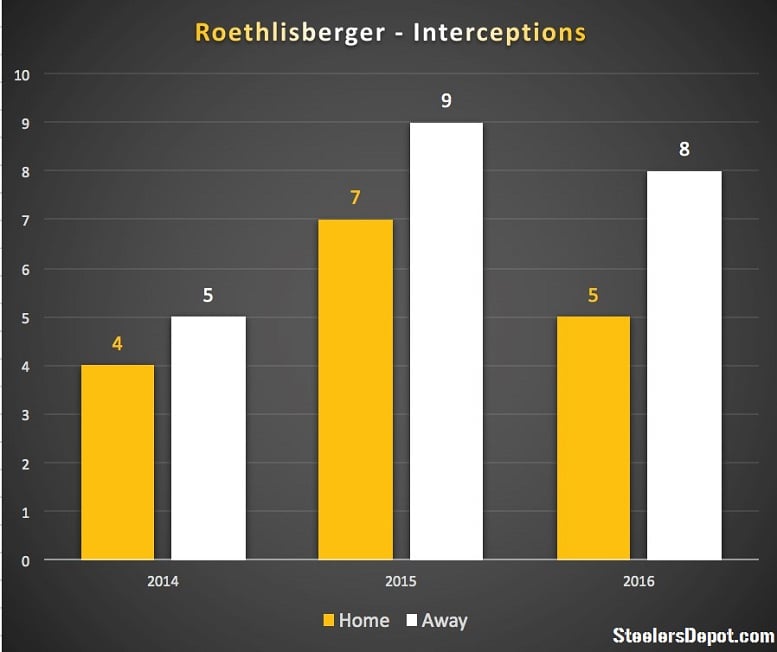
TDs/INTs
The difference between Roethlisberger’s home and away TD/INT numbers is another stat that has been frequently discussed. It’s worth noting that his interceptions per year are fairly similar, even when considering that he played 2 more road games in 2016 than he did home games. However, this obviously makes his smaller TD pass numbers even more surprising. Below is a chart of his year-to-year performance in these categories.
- 2014: 8 Home Games, 8 Away Games
- 2015: 6 Home Games, 6 Away Games
- 2016: 6 Home Games, 8 Away Games
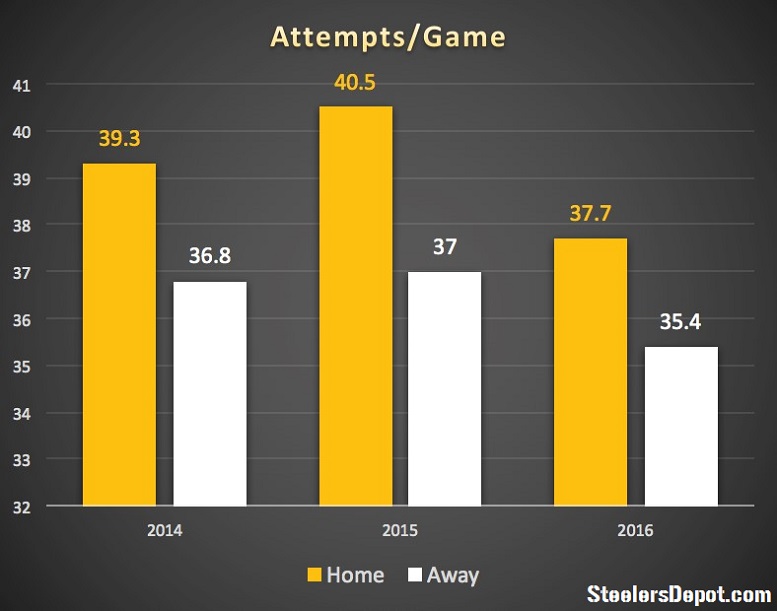
Attempts and Completions Per Game
As you can see from the charts below, Roethlisberger averages roughly 3 fewer attempts and completions per game when on the road compared to when at home, which might be a partial contributing factor for his lower road TD numbers. However, this fact also makes his interception stats more surprising because, with fewer attempts per game, he probably should also have fewer INTs:

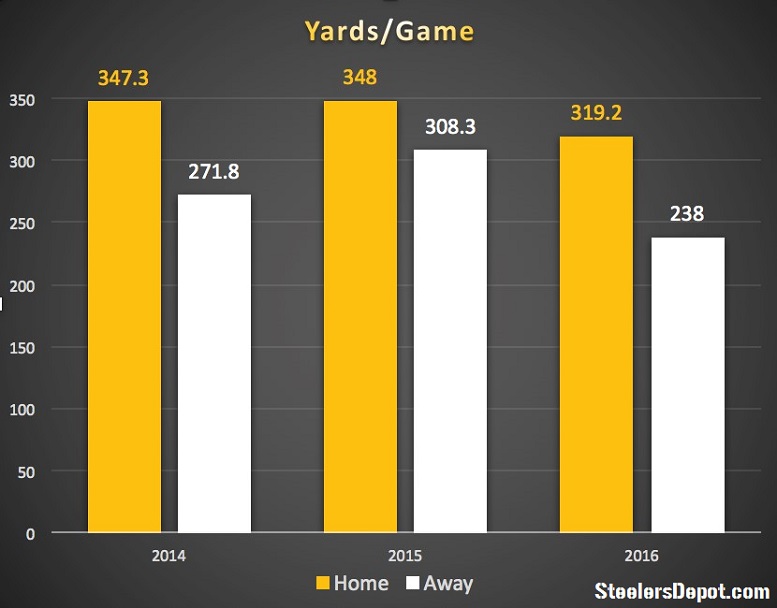
Yards/Attempt and Yards/Game
Lastly, the difference between Roethlisberger’s Home and Away Yards/Game imply that he is less aggressive throwing the ball downfield in road games. Given that he only averages about 3 fewer completions, it is surprising that he throws for nearly 66 fewer yards per game when on the road. His yards/attempt also support the conclusion that he is less aggressive in away games: