In the first part of this study, I charted the differences between Ben Roethlisberger’s home and away QB Rating, TDs/INTs, Attempts and Completions Per Game, Yards/Game, and Attempts/Game and found that he performed worse in each of these categories when playing on the road. In this article, I tried to take an in-depth look at the opponents that Roethlisberger faced from 2014-2016 in hopes of finding a possible explanation for his poor road play. Although I found a couple of things that might partially account for some of his struggles, I was ultimately unable to find a “smoking gun” that could explain his poor performances.
Opponents Win Percentage
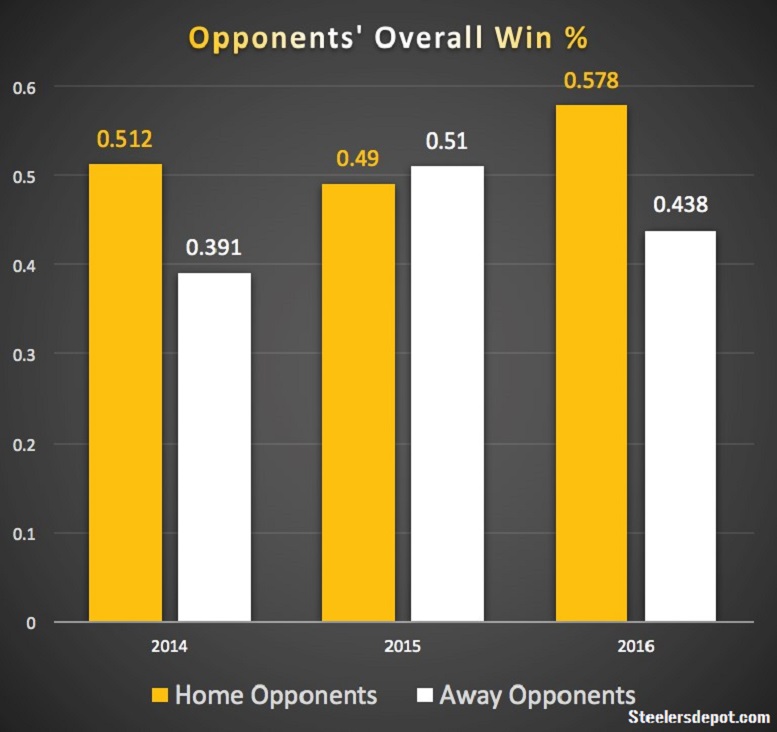
The first thing that I thought might be a factor in Roethlisberger’s struggles was that maybe he simply faced tougher competition on the road. Unfortunately; however, with a very slight exception in 2015, it turns out that he actually played better opponents when at home:
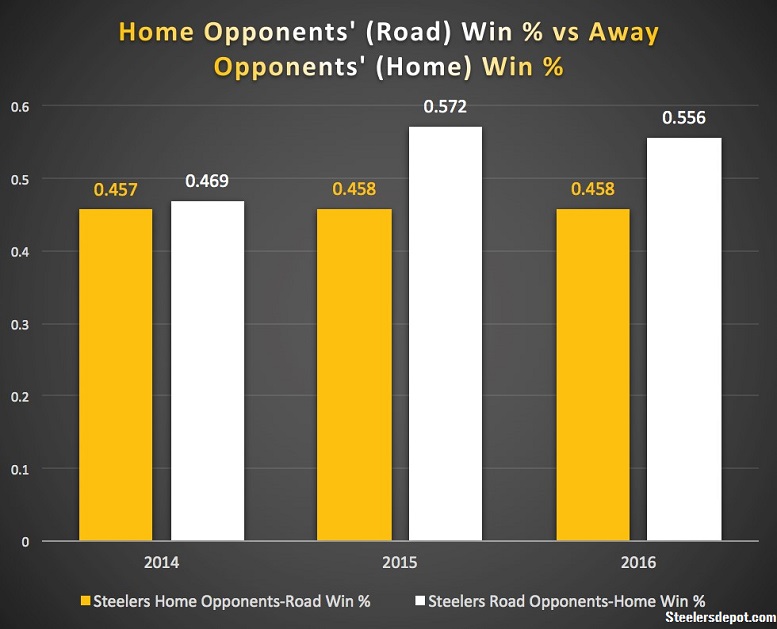
Next, I thought that Roethlisberger’s road opponents might be better teams when playing at their home field and that his home opponents might generally play worse when on the road (compared to their overall win %). Although this did, in fact, turn out to be the case, it obviously does not entirely explain his problems. Almost every NFL team plays better at home (and worse on the road), but not every Quarterback shows a similar decline in their quality of play, especially other elite QBs. Nevertheless, as you can see from the chart below, Roethlisberger did face somewhat tougher competition when on the road, if we are only evaluating based on his opponent’s exclusive home or away win percentages, rather than their overall win percentage:
Opposing Defenses
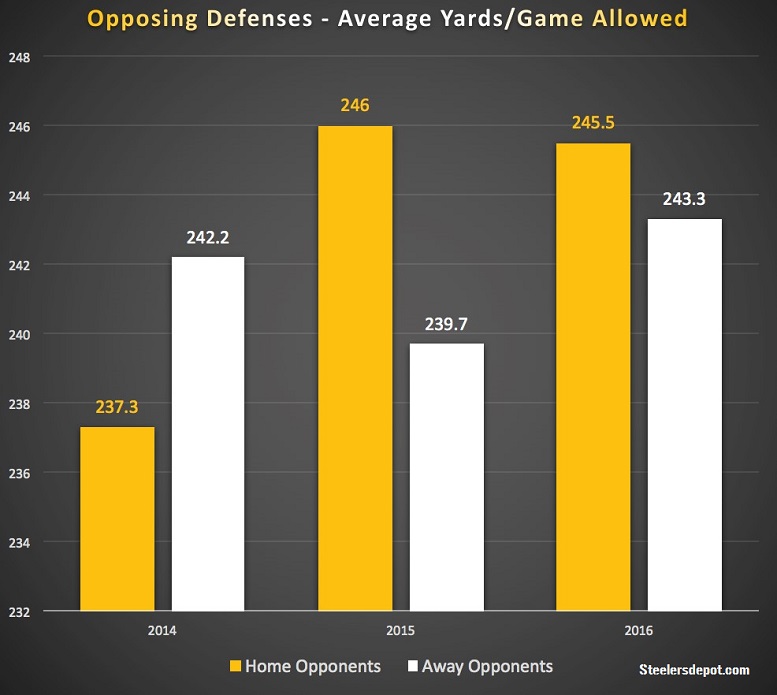
I also looked at the individual defenses that Roethlisberger faced, and tried to see if he specifically played against tougher defenses on the road (rather than tougher overall teams). First, I found that, on average, the defenses he faced allowed about 2 fewer points per game at their home stadiums compared to the defenses he played at Heinz Field (who were away from their home stadiums). While this possibly shows that Roethlisberger played against easier defenses at Heinz Field, this stat obviously cannot fully explain the huge disparity between his home/away TD pass numbers, given that he averaged about two more TD passes in home games than to away games. (Just to be clear, the Yellow Bars in the graph below represent the average Points Allowed/Game that opponents surrendered in their road games in each season, whereas the White Bars represent the average Points Allowed/Game that opponents surrendered in their home games. Sorry if this is confusing).

I also found that Roethlisberger was sacked more often in road games than he was in home games. This stat probably has at least a small causal relationship with his poor road performances, given that QBs generally perform worse when under more pressure; however, it is at best only a partial explanation since the home and away sack totals are fairly similar.

I also charted the average QB Rating and the average Yards/Game that other quarterbacks achieved against Roethlisberger’s road opponents and compared it to the averages other QBs achieved against his home opponents. Using this metric, I found that he faced slightly easier defenses on the road when looking at QB Rating (which makes his poor road QB Rating even more bizarre), but slightly tougher defenses when it comes to average Yards/Game:

- For reference: In 2014, Roethlisberger had an average home QB Rating of 114.8 and an average road QB Rating of 91.0.
- In 2015, he had an averaged rating of 102.4 at home and 86.0 on the road.
- In 2016, he averaged 116.7 at home and only 78.4 on the road.
- This statistical trend is very surprising, given that Roethlisberger seemingly shredded his comparatively stronger home competition, but struggled greatly against weaker road defenses.
- For reference: In 2014, Roethlisberger averaged 347.3 y/g at home and 271.8 y/g on the road.
- In 2015, he averaged 348 y/g at home and 308.3 y/g on the road
- In 2016, he averaged 319.2 y/g at home and 238 y/g on the road.
- It’s worth noting that although Roethlisberger shows a decline in his yards per game in road games, he still generally performed well above the average QB in this category.
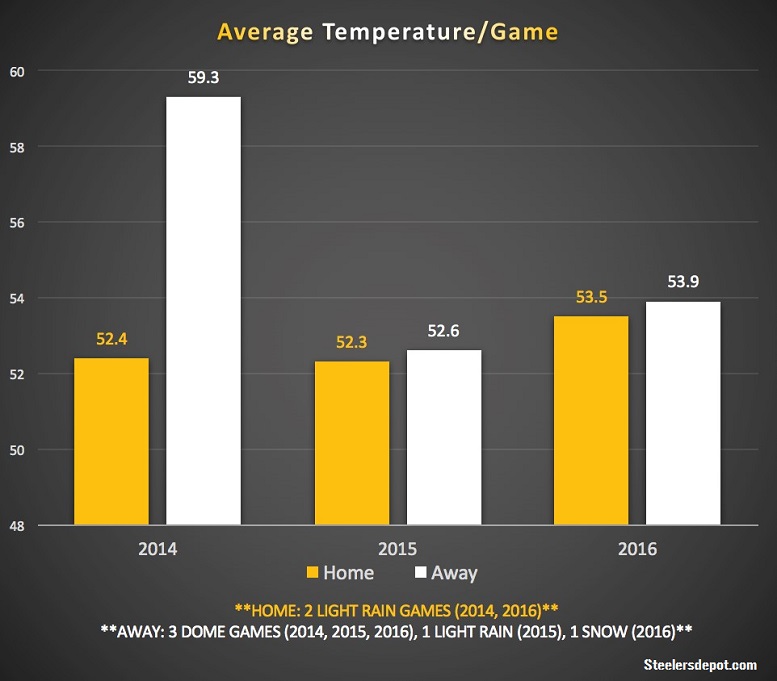
Weather Conditions
Lastly, I wanted to see if weather conditions were a possible contributing factor to Ben’s road struggles. Unfortunately, he played in an equal number of rain/snow games and his road games were also slightly warmer on average. Moreover, Roethlisberger also played in several Dome games on the road, which obviously make the weather a non-issue: