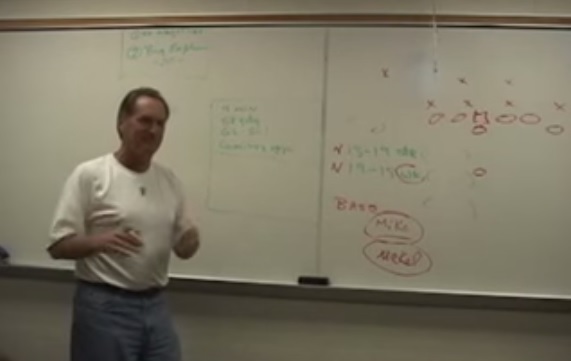
I was watching an old video of famous offensive line coach Alex Gibbs teach the way he coaches his offense. It was a long, multi-part video that I had to stop watching because the audio went out of sync. But within the half hour I caught, he said something very key. The overall emphasis to measure the success of his offensive line each year.
“Our (offense) is predicated on two things. Everything you’re going to hear today is going to be predicated on: no negatives. If there are runs that are negatives, I don’t give a f*** how good those good ones were…we want to be the bottom team in negatives…if the run is a no negative, we never create third and real long….based on talent, we want the real big play, the big explosion play….that’s a twenty yard run. If we can lead in those two categories, all that other s*** takes care of itself…I want no negatives and I want big explosives.”
Spoken colorfully like a true offensive line coach. I’ll include it here.
That made me interested in who did that the best in 2014 and of course, how the Pittsburgh Steelers stacked up.
Pro Football Reference’s play index was my leaping off point. It allowed me to sort through and find the number of negative and 20+ runs, team by team. Numbers are all relative. A team with more rushes would reasonably be expected to have more 20+ runs and more negatives. To counter that out, I took the average per carry and used that figure as my guide.
For explosive runs, the lower the number, the better. One explosive run every 10 carries is better than one every 25 carries, of course. For negative runs, the higher the number, the better.
I ranked each team in both categories and then took the average of those rankings to give a final score. The lower the number, the better.
I’ll leave it at the bottom for anyone who is interested, but I started the research using all carries. That included attempts by quarterbacks. After looking at the set of data more closely, I realized that wasn’t the best system to work. Some quarterbacks are able to bust off long runs on scrambles, not designed runs. That doesn’t measure the success of a rushing offense.
Negatives were even worse. Kneel downs skewed the negative carries heavily. It penalized successful teams and rewarded bad ones who usually weren’t in a position to kneel. That’s partially how the Jacksonville Jaguars “won” the first study.
It took much more manual work to sort out all of the quarterback runs but I managed to do it. The results of the more refined study is shown below. Feel free to sort any category. The default is ranked by overall score.
| TEAM | TOT CAR | 20+ | AVG | RANK | NEG | AVG | RANK | SCORE | OVERALL RANK |
|---|---|---|---|---|---|---|---|---|---|
| DEN | 419 | 13 | 32.2 | 4 | 35 | 12 | 2 | 3 | 1 |
| MIN | 353 | 11 | 32.1 | 3 | 30 | 11.8 | 3 | 3 | 1 |
| CIN | 431 | 12 | 35.9 | 8 | 38 | 11.3 | 5 | 6.5 | 3 |
| DAL | 476 | 18 | 26.4 | 2 | 48 | 9.9 | 14 | 8 | 4 |
| NO | 379 | 10 | 37.9 | 10 | 34 | 11.1 | 6 | 8 | 4 |
| BAL | 405 | 24 | 16.9 | 1 | 42 | 9.6 | 17 | 9 | 6 |
| GB | 382 | 11 | 34.7 | 6 | 38 | 10.1 | 12 | 9 | 6 |
| PIT | 388 | 9 | 43.1 | 14 | 35 | 11.1 | 6 | 10 | 8 |
| KC | 367 | 9 | 40.8 | 13 | 35 | 10.5 | 9 | 11 | 9 |
| SEA | 407 | 9 | 45.2 | 16 | 37 | 11 | 8 | 12 | 10 |
| JAC | 300 | 8 | 37.5 | 9 | 32 | 9.4 | 19 | 14 | 11 |
| ATL | 343 | 7 | 49 | 19 | 34 | 10.1 | 12 | 15.5 | 12 |
| TEN | 309 | 4 | 77.3 | 30 | 21 | 14.7 | 1 | 15.5 | 12 |
| HOU | 517 | 11 | 47 | 17 | 53 | 9.8 | 15 | 16 | 14 |
| NE | 392 | 7 | 56 | 22 | 38 | 10.3 | 10 | 16 | 14 |
| WSH | 340 | 10 | 34 | 5 | 40 | 8.5 | 27 | 16 | 14 |
| NYG | 437 | 4 | 109.3 | 31 | 38 | 11.5 | 4 | 17.5 | 17 |
| NYJ | 421 | 8 | 52.6 | 20 | 43 | 9.8 | 15 | 17.5 | 17 |
| PHI | 421 | 12 | 35.1 | 7 | 53 | 7.9 | 30 | 18.5 | 19 |
| OAK | 306 | 5 | 61.2 | 27 | 30 | 10.2 | 11 | 19 | 20 |
| MIA | 341 | 9 | 37.9 | 10 | 41 | 8.3 | 29 | 19.5 | 21 |
| STL | 369 | 7 | 52.7 | 21 | 40 | 9.2 | 22 | 21.5 | 22 |
| TB | 318 | 8 | 39.8 | 12 | 41 | 7.8 | 31 | 21.5 | 22 |
| DET | 353 | 6 | 58.8 | 23 | 38 | 9.3 | 21 | 22 | 24 |
| SF | 365 | 6 | 60.8 | 26 | 39 | 9.4 | 19 | 22.5 | 25 |
| IND | 343 | 5 | 68.6 | 28 | 36 | 9.5 | 18 | 23 | 26 |
| BUF | 336 | 7 | 48 | 18 | 40 | 8.4 | 28 | 23 | 26 |
| CLE | 437 | 10 | 43.7 | 15 | 58 | 7.5 | 32 | 23.5 | 28 |
| ARI | 364 | 6 | 60.7 | 25 | 41 | 8.9 | 24 | 24.5 | 29 |
| SD | 361 | 6 | 60.2 | 24 | 41 | 8.8 | 25 | 24.5 | 29 |
| CHI | 313 | 2 | 156.5 | 32 | 34 | 9.2 | 22 | 27 | 31 |
| CAR | 362 | 5 | 72.4 | 29 | 42 | 8.6 | 26 | 27.5 | 32 |
The Steelers did well, finishing with the eighth highest score. Their 20+ yard runs were only a tick above average, finishing 2014 with nine, and an average of once every 43.1 carries. Le’Veon Bell had eight while LeGarrette Blount’s 50 yarder in Week 3 rounded things out.
If you’re curious, the Baltimore Ravens’ Justin Forsett led the league with 17. An obvious reason why they finished at the top in this category.
The Steelers did much better in the negative runs, ranking sixth in the league, with 35 overall and once just every 11.1 attempts. Probably one of your last guesses, the Tennessee Titans had the best figure. Bishop Sankey, as average of a year he had, lost yards on only 12 carries all season. Shonn Greene had only one the entire season and that came in Week One.
Overall, two other AFC North teams finished in the top ten. The Cincinnati Bengals in third and the Baltimore Ravens sixth. The Cleveland Browns finished last in the division, sitting in 28th.
Despite rushing attacks that were only slightly above to below average, the Denver Broncos and Minnesota Vikings tied for first. The Broncos made Gibbs proud, finishing fourth in explosive runs and second in negative carries. The Vikings were third in each.
At the bottom were the Chicago Bears and Carolina Panthers. The Bears lack of 20+ runs is astounding when you consider they still have Matt Forte. Across 266 carries, he had just one explosive play. Their leader in that category was Jay Cutler who had more than all the Bears’ backs combined, three. Incredible.
Gibbs cautioned to using the word “efficiency” with these metrics but they help determine overall rushing effectiveness. And are goals every team should have entering each season.
Chart without subtracting quarterback’s attempts:
| TEAM | TOT CAR | 20+ | AVG | RANK | NEG | AVG | RANK | SCORE | OVERALL RANK |
|---|---|---|---|---|---|---|---|---|---|
| JAC | 360 | 15 | 24 | 2 | 35 | 10.3 | 2 | 2 | 1 |
| MIN | 413 | 11 | 37.5 | 10 | 41 | 10.1 | 3 | 6.5 | 2 |
| KC | 420 | 11 | 38.2 | 11 | 43 | 9.8 | 4 | 7.5 | 3 |
| SEA | 525 | 17 | 30.9 | 5 | 60 | 8.8 | 11 | 8 | 4 |
| CIN | 492 | 14 | 35.1 | 8 | 53 | 9.3 | 10 | 9 | 5 |
| TEN | 356 | 7 | 50.9 | 19 | 33 | 10.8 | 1 | 10 | 6 |
| DAL | 508 | 19 | 26.7 | 3 | 65 | 7.8 | 18 | 10.5 | 7 |
| BAL | 448 | 24 | 18.7 | 1 | 59 | 7.6 | 20 | 10.5 | 7 |
| NO | 406 | 10 | 40.6 | 14 | 43 | 9.4 | 7 | 10.5 | 7 |
| WSH | 401 | 11 | 36.5 | 9 | 47 | 8.5 | 14 | 11.5 | 10 |
| ATL | 372 | 7 | 53.1 | 20 | 39 | 9.5 | 6 | 13 | 11 |
| TB | 353 | 8 | 44.1 | 15 | 41 | 8.6 | 12 | 13.5 | 12 |
| OAK | 337 | 6 | 56.2 | 21 | 36 | 9.4 | 7 | 14 | 13 |
| NYJ | 507 | 9 | 56.3 | 22 | 54 | 9.4 | 7 | 14.5 | 14 |
| DEN | 443 | 13 | 34.1 | 7 | 61 | 7.3 | 24 | 15.5 | 15 |
| PIT | 423 | 9 | 47 | 16 | 53 | 8 | 15 | 15.5 | 15 |
| GB | 435 | 11 | 39.5 | 12 | 58 | 7.5 | 21 | 16.5 | 17 |
| SF | 470 | 14 | 33.6 | 6 | 65 | 7.2 | 28 | 17 | 18 |
| PHI | 474 | 12 | 39.5 | 12 | 65 | 7.3 | 24 | 18 | 19 |
| NYG | 449 | 4 | 112.3 | 32 | 46 | 9.8 | 4 | 18 | 19 |
| MIA | 399 | 13 | 30.7 | 4 | 61 | 6.5 | 32 | 18 | 19 |
| STL | 395 | 7 | 56.4 | 23 | 50 | 7.9 | 16 | 19.5 | 22 |
| HOU | 551 | 11 | 50.1 | 18 | 74 | 7.4 | 22 | 20 | 23 |
| BUF | 402 | 7 | 57.4 | 24 | 51 | 7.9 | 16 | 20 | 23 |
| CAR | 473 | 7 | 67.6 | 30 | 55 | 8.6 | 12 | 21 | 25 |
| CLE | 477 | 10 | 47.7 | 17 | 69 | 6.9 | 29 | 23 | 26 |
| SD | 398 | 6 | 66.3 | 29 | 52 | 7.7 | 19 | 24 | 27 |
| IND | 415 | 7 | 59.3 | 25 | 57 | 7.3 | 24 | 24.5 | 28 |
| NE | 438 | 7 | 62.6 | 26 | 60 | 7.3 | 24 | 25 | 29 |
| CHI | 355 | 5 | 71 | 31 | 48 | 7.4 | 22 | 26.5 | 30 |
| DET | 396 | 6 | 66 | 27 | 57 | 6.9 | 29 | 28 | 31 |
| ARI | 397 | 6 | 66.2 | 28 | 58 | 6.8 | 31 | 29.5 | 32 |