A few quick notes about my methodology:
- This study charts 421 pass attempts from 14 games (8 Home, 6 Away). Although I wanted to catalogue all of Joshua Dobbs’ throws, these 14 games were the only ones that were available on DraftBreakdown.com. I still believe that the data is representative of his overall game, even if his “true” completion percentages are slightly different.
- Dropped passes were counted as completions in this study. The job of the quarterback is to get the ball accurately to his receivers, and he fulfills this duty even on plays were the receiver drops the ball.
- When charting Dobb’s footwork, I recorded the drop back type that he actually performed, rather than the traditional drop associated with a particular route. For example, Quarterbacks typically take a 1-step drop from shotgun when throwing slant routes; however, Dobbs sometimes took 3-steps instead. I recorded what Dobbs did on each play, NOT the typical drop back.
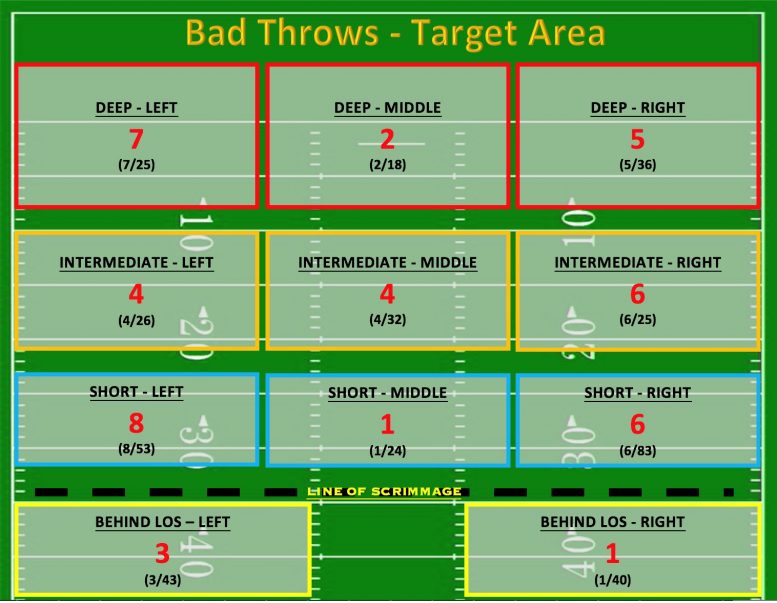
- When recording Dobb’s bad throws, I only counted throws that were complete misses, such as one-hopping a wide open hitch route or throwing far behind an open receiver on digs/slants. For Deep Vertical routes, I only counted passes where Dobb’s never gave his receiver a chance to make a catch by accidently throwing the ball far out of bounds. I also included blatantly poor decisions that ended as interceptions in the “bad throw” category. None of these passes were ticky-tacky judgments and instead they were all very clear bad throws directly attributable to QB accuracy. If it was close, I gave Dobbs the benefit of the doubt.
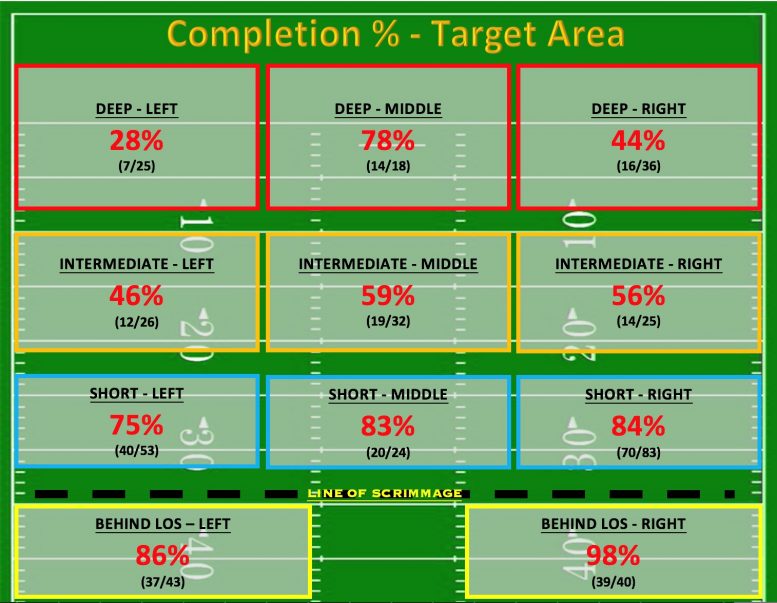
- When calculating Dobb’s completion percentage by Target Area, I did not include “Throw-Away” passes, which is why the total throws in that chart do not add up to 421 attempts.
- Lastly, I did not categorize the routes by depth (for example, I only charted Out-Routes generally, rather than Deep Outs vs. Speed Outs). I used my “Target Area” analysis to capture the differences in route depth.
- My full data log also includes the down/distance for each pass, whether Dobbs was under pressure on the throw, and the yards gained on the play. If you’re curious about this info or would like to take a look at the data for yourself, I’d be happy to send it to you via Twitter. Hopefully this report helps highlight the areas of Dobbs passing game in which he excels, as well as the areas where he can improve.
Completion Percentage by Route Type

- Completions/Attempts per Route: Crosser (11/11), Bubble (30/31), RB Screen (17/19), Wheel (6/7), Hitch (67/79), Flat (44/52), Curl (20/26), Seam (9/12), Post (12/17), Out (19/28), Comeback (7/13), Corner (7/13), Slant (18/36), Dig (11/22), Deep Vertical (10/36), Back Shoulder Fade (1/4), Fade (1/6)
Completion Percentage by Drop Back Type

- Completions/Attempts per Drop Back Type: Screens (50/56), Play Action – 1 Step Drop (15/19), Roll Right (22/30), Roll Left (11/15), 3-Step Drop (99/146), 1-Step Drop (38/56), 5-Step Drop (12/18), Fake Screen (6/10), Play Action – 3 Step Drop (23/39), Scrambles (No Throw-Aways) (11/19), Play Action – 7 Step Drop (Under Center) (1/2)
Completion Percentage by Down
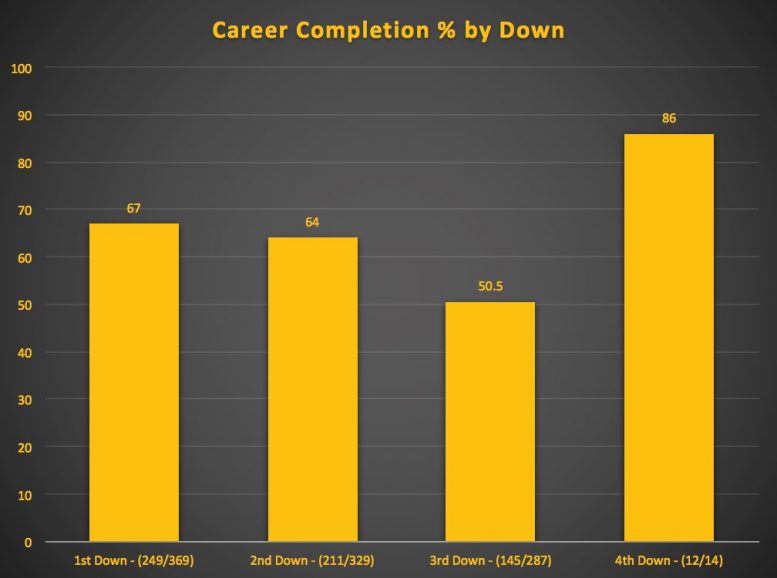
- Completions/Attempts per Down: 1st Down (249/369), 2nd Down (211/329), 3rd Down (145/287), 4th Down (12/14)
Completion Percentage by Target Area
Number of Bad Throws by Target Area
Number of Bad Throws by Route
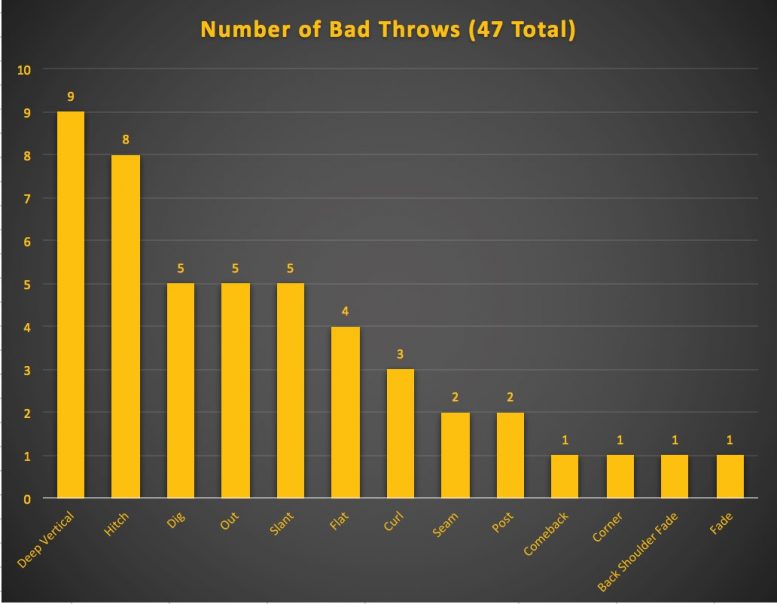
- Total Attempts Per Route: Deep Verticals (36), Hitch (79), Dig (22), Slant (30), Flat (52), Curl (26), Seam (12), Post (17), Comebacks (13), Corner (13), Back Shoulder Fade (4), Fade (6), Throw-Aways (15)


