Do the Pittsburgh Steelers have a red zone problem? That’s the question I set out to answer after the last several seasons. Despite an offensive roster boasting a future Hall of Fame QB, one of the greatest WRs of all time, a high quality line, and a top flight RB, the Steelers finished 22nd in red zone conversion rate in 2017 with only 50.79% of their trips ending with a TD. 2016 they were better with 59.2% for 13th. 2015 it was 60.7% for 10th best. So never top of the line, but 2017 took a serious drop to truly bad.
So I did some studies to figure out what’s going on. They all generally led me to the belief that RZ% is a pretty worthless stat.
Firstly, the Steelers were excellent at scoring near the goal line. The past 3 seasons they ran 107 plays from the 5 yard line or closer, and scored on 56 of them for a 52.3% conversion rate, 3rd best in the league. 2017 was no different, going 19 for 36, for the 2nd best rate. I think you’re seeing “7 shots” paying off here. Makes it even more perplexing as to why the overall red zone% is low.
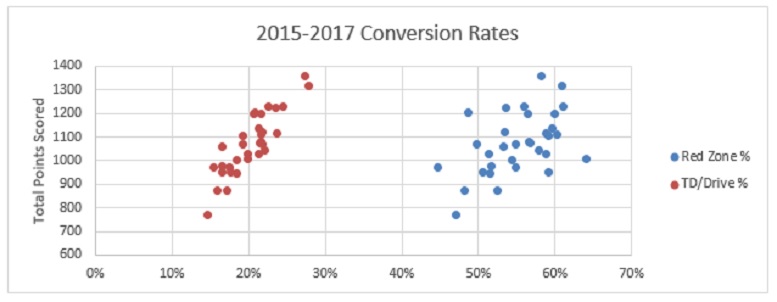
My next surprise finding was that red zone conversion rate has pretty poor correlation to the total points scored by a team during a season. Look at the graph below and you’ll see that RZ% does have a general loose trend with points scored, but TDs per drive has a much tighter correlation. This leads me to believe it’s just not a good stat. The idea is you score less on your opportunities, but it doesn’t translate over a full season very consistently. In 2017 the Steelers scored the 5th most offensive TDs, the 6th most TDs per drive, the 4th most points per drive, the 2nd best TD rate on plays from the 5 or closer, and yet they ranked 22nd in RZ%. Something doesn’t add up.
The other trend that stands out is just how much teams move up and down the rankings year to year. Again we’ll look at 2015-2017. The Steelers’ peak was 60.71% (10th) in 2015, low 50.79% in 2017 (22nd). That’s 12 spots in ranking and 9.92% range over just 3 seasons. On average, teams had a ranking range of 16.0 over that period. So that means just within 3 seasons teams RZ% ranking moves through about half the teams. That’s crazy high variance over that short of a period. You’d expect teams to be more consistent. Some were, such as the Patriots consistently good, and The Buccaneers consistently bad). But the Browns went from 32nd to 16th. Packers from 19th in 2015 to 3rd in 2017, getting significantly better in a year they lose Rogers.
I think the driving force behind all this is not all red zone trips are created equal. For example, getting a 1st and 10 at the 15 is really different than a 3rd and 6 at the 19. With relatively small sample sizes, things like this can skew the percent for one team a lot more than for another.
I decided to do a deep dive and look at every Steelers RZ trip in 2017 and compare it to the Eagles, Jaguars, and Patriots, who all had top 5 RZ% in the NFL. I also looked at the Falcons who ranked right behind the Steelers, and also have strong offensive personnel. Here is what I learned….
There are lots of RZ trips, all with specific details that make them successful or not. So I wanted to get a “REAL RZ%.” I eliminated the follow types of trips from all teams.
-A single drive with multiple trips (got just inside, pushed out, came back in) get counted as 1 trip.
-End of game scenarios up by multiple scores where the team strictly ran the ball and drained the clock. A FG is a win at this point. It had to be clear the team was not playing for the TD, any question and the drive was kept. (a couple times teams were up big, but were still throwing the ball multiple times in the RZ, so the trip counted).
-End of half FGs not on 4th down (i.e. ran out of time, not downs).
-Obvious stuff such as kneel downs.
-Another Note. I use Pro Football Reference. By their data, the Steelers had 63 RZ trips. When going through drive by drive, I came up with 67. Difference appears to be I counted the 20 yard line as the RZ, while they counted the 19 as the RZ. There were 4 drives that featured one play from the 20 and no others from inside the RZ. My data will include the 20 yard line as RZ because I didn’t want to redo it, and I thought it’d be good to see if that 1 yard change made a difference.
The Data for 2017:
| Team | Pts/Dr | Pts/Dr Rank | RZ Trips | RZ TDs | RZ% | RZ% Rank | REAL RZ Trips | REAL RZ TDs | REAL RZ% | Delta RZ% | Avg Start LOS | Avg Start Dwn | % start inside 10 |
|---|---|---|---|---|---|---|---|---|---|---|---|---|---|
| PIT | 2.23 | 4th | 63 | 32 | 50.8 | 22nd | 56 | 34 | 60.7 | 9.9 | 15.6 | 1.39 | 10.7 |
| PHL | 2.21 | 5th | 55 | 36 | 65.5 | 1st | 53 | 37 | 69.8 | 4.4 | 13.7 | 1.3 | 24.5 |
| JAX | 1.82 | 14th | 50 | 32 | 64 | 2nd | 49 | 32 | 65.3 | 1.3 | 13.9 | 1.29 | 24.5 |
| NE | 2.61 | 1st | 70 | 42 | 60 | 5th | 67 | 42 | 62.7 | 2.7 | 13.2 | 1.24 | 26.9 |
| ATL | 2.06 | 7th | 54 | 27 | 50 | 23rd | 49 | 27 | 55.1 | 5.1 | 13.9 | 1.57 | 22.4 |
Going from the basic RZ% to my REAL RZ%, all teams went up, but by different amounts. Only a 1.3% bump for JAX vs 9.9% for Steelers.
Here are the drive adjustments the Steelers saw:
| DRV | Reason Excluded |
|---|---|
| 1 | End of half, FG on only RZ play. |
| 2 | Two RZ trips on same drive (due to penalty) counted as 1 trip. |
| 3 | End of half, FG on 3rd down. |
| 4 | Two RZ trips on same drive (due to penalty) counted as 1 trip. |
| 5 | End of half, FG on 3rd down. |
| 6 | End of game, up 12 with 6 min left, ran all 3 plays, kicked FG. |
| 7 | Knee to end game. |
| 8 | End of game, FG to win on 3rd down as time expired. |
| 9 | Knee to end game. |
| 10 | End of half, FG on 1st down. |
| 11 | End of game, FG to win it on only RZ play. |
The Steelers had a lot more of this type stuff happen than the other teams investigated. So, instead of there being a 9.2% difference between Steelers and Patriots, there was 2.0% difference, which certainly looks a lot better. This really changes the picture from the red zone being a clear problem for the Steelers, to them just not being elite.
The other thing that caught my eye was the average starting position. On average, a Steelers REAL RZ trip started at the 15.6 yard line on 1.39 down. All the other teams were at least 1.7 yards closer to start on average. Only the Falcons started on a lower down.
If you look specifically at how many RZ trips started inside the 10, you see a drastic difference. The Steelers only started 10.7% of their trips with the ball at the 10 or closer. The other 4 teams were all over double that rate. One would expect a difference in success rates when starting inside the 10, as compared to just inside the 20. And with the Steelers being so good in goal line situations, if they could start their red zone trips deeper in the opponent’s end, their conversion rate would probably increase as well.
I wanted to look at the entire league, but this is a lot of work. Best I could do was to remove all non-4th down FGs from all teams. In 2017 the basic numbers start with 65.5% as the best and 39.6% as the worst. After removing those FGs it’s 66.7% and 39.6%. The Steelers saw the biggest increase at 4.4% higher. That changed their rank from 22nd to 15th. Falcons went from 23rd to 24th. Lions saw the biggest drop, from 11th to 14th. Steelers had a league leading 5 non-4th down FGs in the RZ. Boswell’s late game heroics and Steelers knack for getting in a quick FG before halftime are really showing their impact here. If you take it from 2015-2017, the Steelers conversion rate increases from 56.55% to 59.38%. That results in them moving from 13th best to 9th best, the biggest jump in rankings of any team. So with one simple adjustment, it appears the Steelers move from bad to average in 2017, and average to good over a 3 year period. And this is just the FGs, not counting all the other stuff.
In conclusion, I think this study shows that the RZ% stat just isn’t a good one. The percent changes a lot when you account for game circumstances. And RZ trips are not all created equal, as the data showed the Steelers generally had lower quality RZ starting position than the other teams, which one would expect to impact conversion rates. The RZ being drawn as starting at the 19 yard line (or in my case the 20) is also an arbitrary delineation. If you include the entire field, the Steelers actually scored TDs on the 6th highest % of possessions. If you started the RZ at the 25, or at the 15, where teams rank is going to change significantly. As an example, by starting the RZ at the 20 instead of the 19, the Steelers REAL RZ% ended up being 1.5% higher. They had 2 TDs scored off plays from the 20. The Jaguars had no such plays. A good stat wouldn’t have such a significant difference (the “gap” between JAX and PIT is closed by 25% simply by moving the “red zone” by 1 yard).
None of this is meant to excuse the Steelers’ red zone performance. They should be better. But I don’t think it’s as big of a problem as perceived, and I don’t think it’s a particularly good metric. Hopefully you guys found this interesting, and I hope it shed some light that the red zone conversion rate might not be as big of a problem as it seems.